
Who will win this face off?
A few months ago I received the following message from Adam from Boston, a Real Life Rentals subscriber:
“I just wanted to reach out and let you know just how impressed I am with your blog. I'm running into some bumps with my own investments and its just been so wonderful to read yours and get an actual "real" world feel of how someone else is doing. Sometimes you listen to the bigger pockets podcast and they have someone on who's got like 4,000 units and I've got 3 singles and a 2 family and I'm dealing with a broken stove.
Your posts really give me good perspective on my own investments and make me not want to give up even when things are tough!
Here's my question, I'm worried about how over time with all of the issues, these investments aren't going to really be making that much. Overall are you still bullish on real estate in general even with all the issues and the fact that the returns are not where you might have thought they might be originally?”
Wow, it’s messages like this one that fire me up and keep me going! Thanks to Adam for the kind words and also the very thoughtful question.
This is a question that I ask myself ALL THE TIME. I think it’s important to constantly be questioning your approach to anything in life so that you don’t end up with tunnel vision. I don’t want to just put my head down and plow ahead only to realize 20 years later that I made a mistake.
If you are a long time subscriber (or even a new visitor), you know that all has not gone well for my real estate investing. I’ve made some mistakes, learned some lessons, and also got pretty unlucky at times. Maybe this is normal for all real estate investors. Regardless, the question is: even with all the issues affecting my cash flow, did I still make good returns AND was it worth it?
The follow up question is, how do these returns compare to a super passive investment that is touted by masses - such as a low-cost ETF?
Fortunately, I now have THREE YEARS of real estate returns data, which I was able to compile, analyze and compare to the SPY ETF.
Note: I’ve posted an abbreviated version of this on Bigger Pockets HERE - if you have feedback or questions, please post them there. It will help my blog gain some exposure!
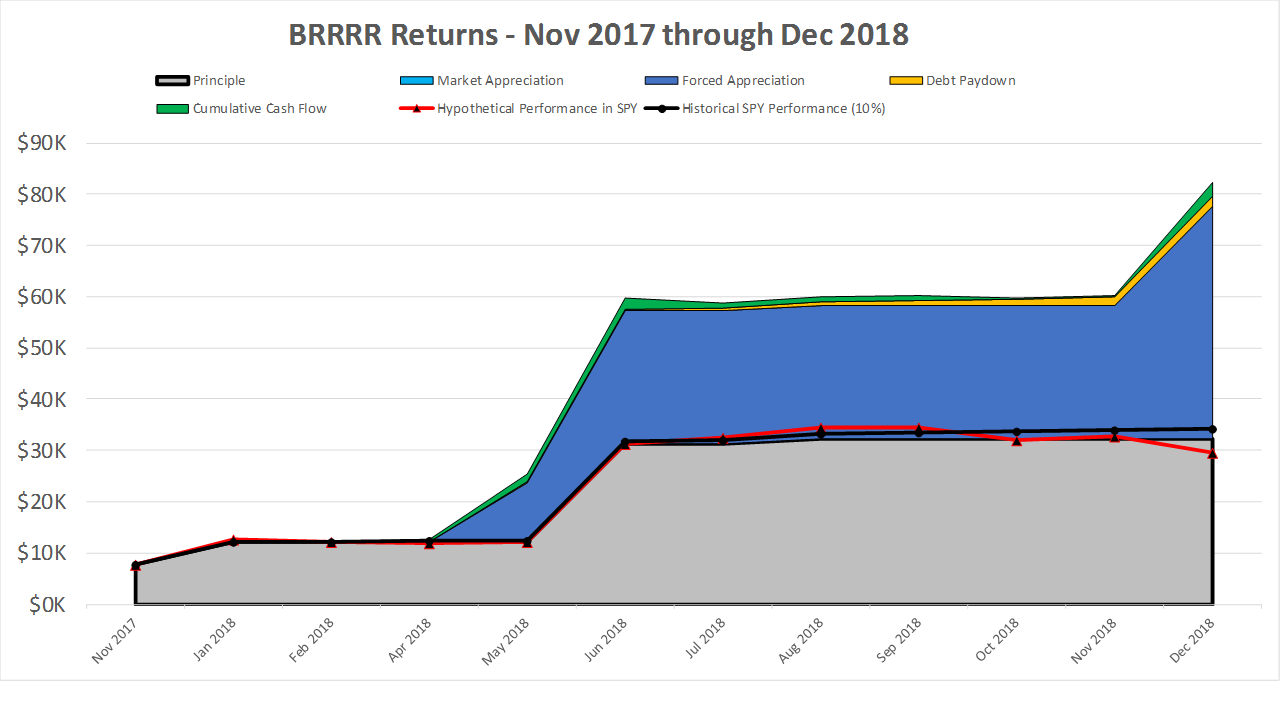
Here's the graph, with explanations and assumptions below (for the personal finance geeks):

REI Total Return - 3 years:
Cash Flow: $25K
Debt Paydown: $26K
Forced Appreciation: $50K
Market Appreciation: $30K
TOTAL Return: $131K return divided by $215K principle = 61%
SPY Modeled Return - 3 years:
TOTAL Return: $38K return divided by $215K principle = 17.6%
Definitions:
Principle - defined as the total money left in the deal. For example, if I bought a $100K property with a 20% down payment and $5K in closing costs, then my total money in the deal would be $25K. This calculation get's a little more complicated for BRRRR's. Let's say through the buy and rehab, including closing costs, I'm all in for $82K, and I get $76K back. My principle in this scenario would be $6K.
Cumulative cash flow - Total cash flow for this time period (Total Income minus total expenses, including PITI)
Debt paydown - Initial debt balance at purchase minus current debt balance
Market appreciation - an increase in appraised value without extensive rehab. These were properties that I obtained HELOC's and re-appraised for more than I paid for them. For example, if I purchased for $100K and it appraised for $105K at a later date, I logged that as "market appreciation" of $5K.
Forced appreciation - a property appraised for more than I paid for it after extensive rehab (a.k.a. BRRRR). Using the example above, if I'm all in for $82K and the property appraises for $100K, then my forced appreciation is $18K.
Assumptions:
To create the Hypothetical SPY graph, I modeled what would happen if I invested the exact same principle with the exact same timing into SPY instead of into a property. Every time you see the principle increase, it means I bought a property that month. You will see the impact of the market tank at the end of 2018.
The Historical SPY graph is similar but assumes that SPY goes up at a consistent (and in my opinion, generous) 10% annual rate.
I only count appreciation if I have a new appraisal. This is conservative. Some of my properties have probably gained market value in the last few years since I bought but I don't want to make that assumption in this analysis until I have a new appraisal.
Taxes have NOT been taken into account - this could be a whole other blog post. Just know that in this 3 year time period, while making positive cash flow each month, my wife and I have a paper loss of over $39K. We are “carrying forward” to loss to future years because we make too much money from our W2 jobs, but at some point we will realize those losses and get a huge tax break - this is worth THOUSANDS of dollars.
Takeaways and Deeper Analysis
My biggest takeaway is that you need appreciation to achieve outstanding returns in real estate. We, as real estate investors, focus so much on cash flow - which I think we should, for many reasons - but I think it's also important to be in a market that has good appreciation prospects AND/OR force appreciation through BRRRR's (Buy, Rehab, Rent, Refinance, Repeat).
Also, BRRRR is clearly the superior buy and hold strategy. I started doing them about a year ago which is where you see my forced appreciation really shoot up in 2018. Plus the amount of principle invested is drastically reduced. This can be clearly seen in the graph below (although admittedly a much smaller sample size). This graph is filtered for only my last 4 properties, which were true BRRRR’s.
The BRRRR strategy has been good to me. While investing only around $32K (my money in the deals), I’ve returned over $45K from appreciation, another $2K from debt paydown, and $2700 from cash flow. If you’re keeping track at home, that’s a whopping 156% return on my principle.
It should of course be noted that BRRRR properties have been like a second job for me. I spend time marketing and networking to find deals, contractors and lenders. I’ve analyzed and visited literally hundreds of properties and submitted offers on dozens, and been rejected over 90% of the time. Once I finally get a deal, I get bids from contractors, secure financing, close on the property, then manage the rehab and all the paperwork to refinance. Then I hand the property over to the property manager and start the process over again.
Let’s compare BRRRR (super active) to Turnkey (super passive, but not as passive as a low cost ETF), in the graph below. This is filtered by Indy Rancher #1 and Indy Rancher #2 (Indy Hipster House was bought wholesale and was definitely not turnkey).

It’s nice to see that even turnkey investing still beats SPY. I’d like to point out that I feel that I got pretty lucky on Indy Rancher #2 - I purchased for $95K but it appraised for $111K, so I started out with $16K of “appreciation” right off the bat. The total returns from my two turnkey properties in the last 2.5 years has been 78%. Take away that “lucky” appreciation, and I’m at a 40% return from the last 2.5 years. Still beats SPY!
Conclusion
Pretty much any way you look at it, there is really no contest - real estate wins against stocks from a pure numbers standpoint. I think at the end of the day it is more important to not only be mindful of how much time you spend on real estate, but also how much you enjoy it. It really is an active investment, especially if you want to achieve outstanding returns. Just always remember that you are doing this to achieve more freedom and less stress, not the other way around.
I hope you enjoyed the analysis! Remember, if you have questions, criticisms, or feedback on this topic, head on over to Bigger Pockets and contribute to the conversation there.